

| Abbreviation | Meaning | Underlying Benchmark |
|---|---|---|
| PV | Performance Value (PV) is a cumulative measure of AI model's performance across general reasoning (GR), coding (C), math (M), and common sense reasoning (CSR) tasks. PV = (GR + C + M + CSR) / 4 |
Cumulative metric |
| GR | General Reasoning / Knowledge | MMLU |
| C | Coding / Programming | HumanEval |
| M | Mathematical Reasoning | GSM8K |
| CSR | Common Sense Reasoning | HellaSwag |
Ever stood in the bread aisle, squinting at a loaf, wondering if the baker used a specific strain of yeast or the exact molecular structure of its gluten proteins? Of course not! You just flip to that familiar nutrition label to check the carbs, protein, and whether it has more sugar than your morning coffee — basic information everyone learned in science class, not what food scientists or bakers spent years mastering.
One more: You’re booking a flight. Do you care about the aircraft’s thrust-to-weight ratio or the aerodynamic properties of its winglets? Nope. You want departure times, legroom, and maybe how much carbon your trip will pump into the atmosphere.
So why, when it comes to AI models, are everyday consumers, not enterprise IT departments or AI researchers, expected to decipher 60-page model/system cards filled with benchmark scores and statistical jargon that companies proudly call “AI nutrition labels”? To the everyday consumers using these AI systems, it feels like playing eenie-meenie-miney-mo between models, with no real way to make informed choices.
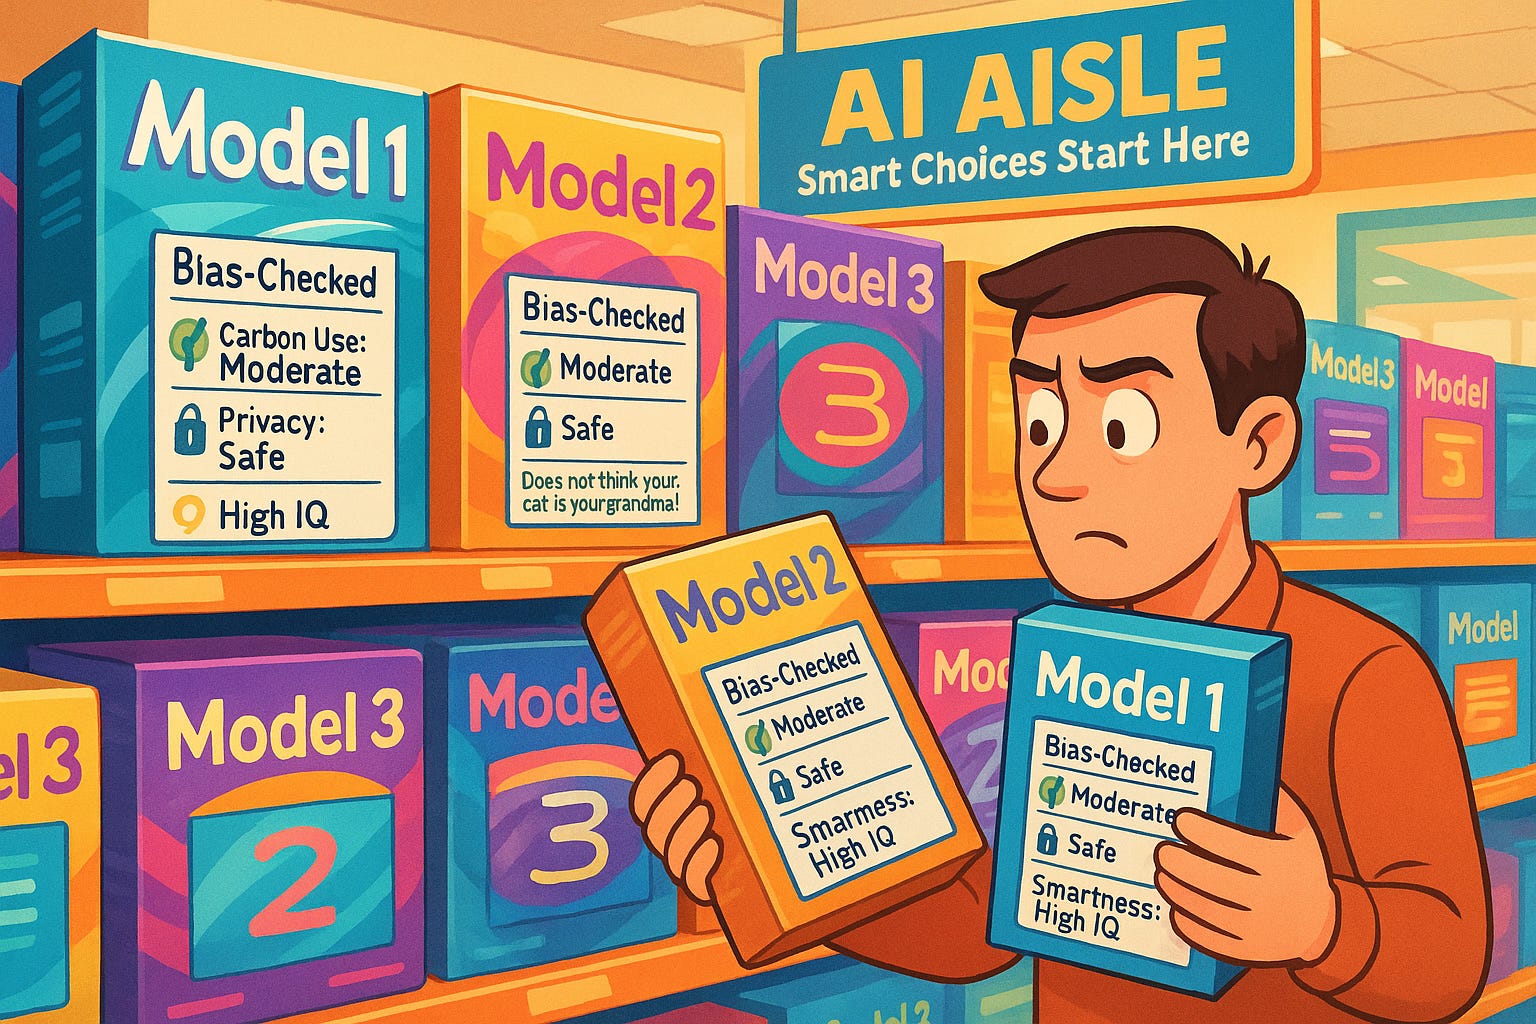
That’s why we’re introducing “AI Nutrition Labels for Everyone” — accessible, valuable information designed for everyday consumers. These aren’t dense technical reports. They’re crisp, straightforward labels written in layman’s language that let you make decisions at a glance. You’ll finally know if the AI model you’re using wastes all the water you’ve saved by turning off the tap when not in use daily, or burns through the electricity you’re conserving by switching off lights every day. And yes, you’ll know whether it can tell the difference between a cat and your grandmother (important stuff!).
Because choosing an AI assistant shouldn’t be harder than picking bread. And you shouldn’t need a computer science degree to make an informed choice.
Ready to see what AI transparency actually looks like? Keep reading. Your brain — and your patience — will thank you.
Introducing the AI Nutrition Label For Everyone: Compare AI models at a glance, just like comparing your everyday bread— no computer science degree required 🤗
Breaking Down the Label: What’s Really Inside Your AI?
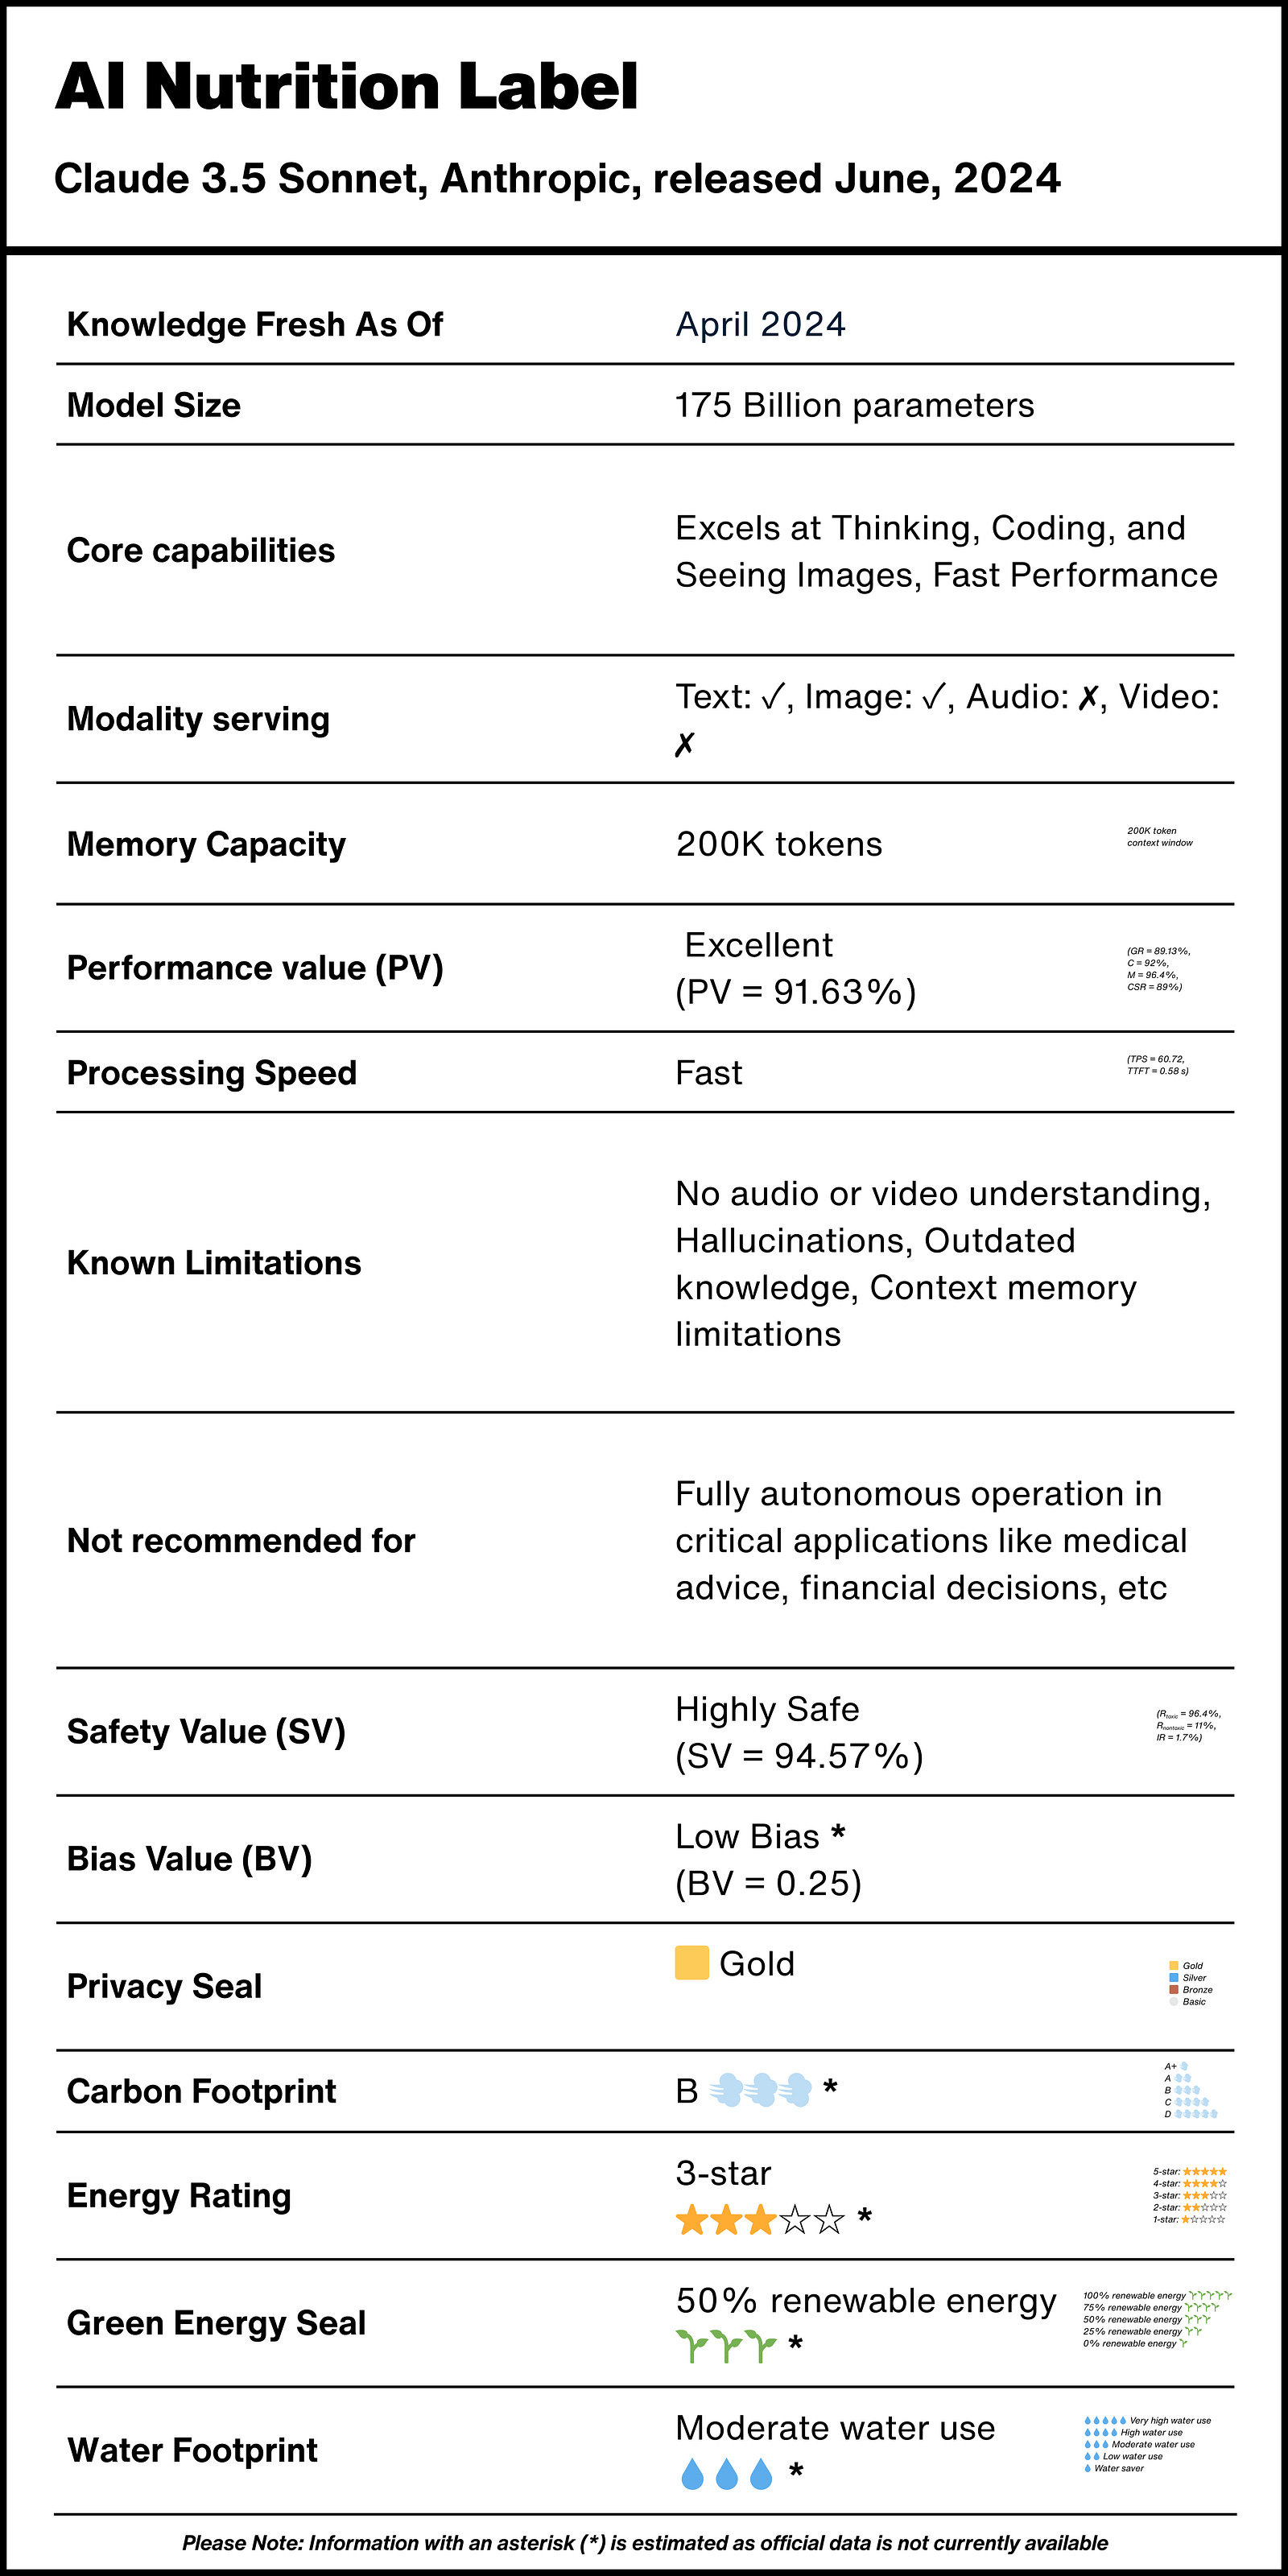
Model Origins — Just like checking the name, its manufacturer, and expiration dates on food, knowing the same for your AI matters. Claude 3.5 Sonnet was released by Anthropic in June 2024, making it a relatively fresh model
Knowledge Fresh As Of — Knowledge cutoff: April 2024. This is crucial! It means this AI model’s “education” stopped in April 2024. Don’t expect it to know about events that happened after this date without searching the web
Model Size — At 175 billion parameters, this tells you how complex the AI’s “thinking” can be. Think of it like a recipe’s ingredient list — a simple recipe might have 5 ingredients for basic flavors, while a gourmet dish has 50 ingredients for complex, nuanced tastes. More ingredients don’t guarantee a better dish, but they allow for more sophisticated flavor combinations
Core capabilities— Claude 3.5 Sonnet excels at thinking, coding, and understanding images, with fast performance. This tells you what tasks this AI is particularly good at —just like how some kitchen knives excel at specific jobs: a chef’s knife for versatile chopping, a bread knife for clean slices, or a paring knife for precise detail work
Modality serving — This model handles text and images (✓) but not audio or video (✗). This is like knowing whether your microwave can handle reheating and defrosting, but not grilling or convection cooking
Memory Capacity — 200K tokens context window. In human terms? This AI model can “remember” extremely long conversations, about the equivalent of a 150-page book
Performance value (PV) — With an excellent Performance Value (PV) of 91.63%, Claude 3.5 Sonnet performs impressively across general reasoning (GR = 89.13%), coding (C = 92%), math (M = 96.4%), and common sense reasoning (CSR = 89%) tasks. Think of this like a restaurant’s overall star rating — a single metric that combines food quality, service, ambiance, and value to help diners make quick, informed decisions
Formula for Performance Value (PV) = (GR + C + M + CSR) / 4Processing Speed— With a fast processing speed rating, Claude 3.5 Sonnet responds near-instantly with higher Tokens Per Second (TPS = 60.72), and generates text quickly with a lower Time To First Token (TTFT = 0.58s). Think of this like a high-end convection oven that preheats rapidly and cooks evenly — when you’re hungry, you don’t want to wait for the oven to warm up or deal with food that cooks slowly and unevenly. Fast AI model, like a good oven, saves you time and delivers consistent results without frustrating delays
Known Limitations — Cannot understand audio/video, may make up information (hallucinate), has outdated knowledge, and has limited memory within conversations. These are the important warnings, like allergen information on food packaging, that are crucial to know before you rely on it
Not recommended for — Not recommended for fully autonomous operation in critical applications like medical advice or financial decisions. This is like the “not for consumption” warning on food-grade silicone molds — they’re great for their intended purpose, but shouldn’t be used in ways that could cause harm
Safety Value (SV) — With a high Safety Value (SV = 94.57%), Claude 3.5 Sonnet ia Highly Safe across toxic prompts’ refusal rate (Rtoxic = 96.4%), low refusal rate of non-toxic prompts (Rnontoxic = 11%), and low incorrect refusal rate (IR = 1.7%). Think of this like a food safety inspection score, a comprehensive rating that combines proper handling of harmful ingredients, appropriate preservation of nutritious components, and accurate identification of what’s safe to serve, giving consumers confidence about what’s being put on their plate
Formula for Safety Value (SV) = (Rtoxic + (100 − Rnontoxic) + (100 − IR)) / 4Bias Value (BV) —Low Bias Value (BV = 0.25) suggests this model strives to treat different groups fairly based on age, SES, nationality, religion, physical appearance, etc. Similar to fair trade certifications on coffee, this tells you something about the ethical stance behind the product
Potential formula for Bias Value (BV) = Weighted avg. of bias benchmark values (on a scale of 0 to 1)

Possible bias benchmark values:
Benchmark 1 (like BBQ for English: https://arxiv.org/abs/2110.08193)
Benchmark 2 (like BBQ for Korean: https://arxiv.org/abs/2307.16778)
Benchmark n (like BBQ for Indian: https://arxiv.org/abs/2403.20147), etc
Note: Claude 3.5 Sonnet evaluations don’t exist for the different bias benchmarks. Hence, we make an assumption for our bias value rating just based on the BBQ benchmark.
Privacy Seal — The 🟨 Gold privacy seal (highest standard) means your data isn’t used for training. This is like knowing a restaurant doesn’t repurpose your leftover ingredients — what you bring to the table stays with your meal and doesn’t end up in someone else’s dish tomorrow
Carbon Footprint — B-grade (💨💨💨) for carbon emissions tells you the climate impact of using this AI model. Think of this like checking a meal’s calorie count — it helps you understand the environmental cost of what you’re consuming, whether it’s a resource-intensive AI or a lighter option that leaves a smaller footprint
Note: Claude 3.5 Sonnet’s actual carbon footprint data isn’t available. We’ve used an estimated B-grade based on industry averages, on a scale ranging from A+ (very high) to D (minimal)
Energy Rating — 3-star energy rating (⭐️⭐️⭐️☆☆) shows moderate energy efficiency. Similar to the energy ratings on appliances.
Note: Claude 3.5 Sonnet’s energy rating is estimated at a 3-star rating, on a scale ranging from a 5-star rating (extremely efficient) to a 1-star rating (high energy consumption), as official data is not currently available.
Green Energy Seal — 50% renewable energy (🌱🌱🌱) indicates half of the power used comes from sustainable sources. This is like knowing whether a restaurant uses locally-grown organic ingredients or imported conventional ones — it tells you about the sustainability practices behind what you’re consuming
Note: Claude 3.5 Sonnet’s green energy seal is estimated at 50% renewable energy usage, on a scale ranging from 100% renewable energy usage to 0% renewable energy usage, as official data is not currently available.
Water Footprint — Moderate water use (💧💧💧) shows how much water cooling these massive AI systems requires. Yes, digital products use physical resources too!
Note: Claude 3.5 Sonnet’s water footprint is estimated as “Moderate water use,” on a scale ranging from “Water Saver” (best) to “Very High water use” (worst), as official data is not currently available.
When you walk into the “AI Aisle” of the digital marketplace, you’re faced with dozens of options. Some are flashy but inefficient. Others are powerful but environmentally costly. Many hide their limitations in technical jargon.
Our AI Nutrition Label cuts through the noise. No more taking a company’s marketing at face value. No more discovering limitations only after you’ve already committed. And importantly, no more accidentally choosing models that consume resources at rates that would make an SUV blush.
What’s Next: Demanding Better Labels
Food nutrition labels weren’t always mandatory. Consumers demanded transparency, and regulations followed. Remember when food companies could slap “all natural” on virtually anything without consequences? That changed when everyday shoppers started asking uncomfortable questions and demanding clarity.
The AI world today resembles the Wild West of food packaging before standardized labels. One company’s “extremely efficient” might be another’s “moderately resource-hungry.” Next time you’re choosing an AI model, ask yourself: Do I know what’s really “inside” it? If not, it’s time to start asking why.
“But wait!” some experts cry, “These simplified metrics lose the nuance of our sophisticated benchmarks!” Let me ask you this: Have you tried comparing existing AI model cards lately? It’s like one cereal box listing sugar in grams while another uses “happiness units” and a third measures in “unicorn sprinkles.” Understanding what you’re using shouldn’t require a computer science degree.
And yes, terms like “Performance Value” and “TTFT” might seem unfamiliar at first. But remember when “calories” and “saturated fats” were new concepts on food labels? We adapted. Today’s AI consumers are certainly capable of the same learning curve, especially with clear explanations like the above.
As AI becomes as common as the smartphone in your pocket, transparency shouldn’t be a luxury feature — it should be the standard ingredient in every AI model. Companies that embrace this kind of clarity won’t just be following best practices; they’ll earn the trust that keeps customers coming back for seconds.
Because making informed choices about the AI you invite into your life should be as easy as reading a nutrition label.
Join the Movement
Ready to demand better labels? Here’s how to get started:
Share this AI Nutrition Label template with friends and on social media
Ask your favorite AI providers directly: “Where’s the AI nutrition label of your AI model?”
Support companies that prioritize transparency over technical jargon
Tell lawmakers you want standardized AI information, just like you have for food
Consumer awareness campaigns could play a crucial role in this transition. Just as initiatives like “Label Padhega India” (meaning “India Will Read the Label”) have successfully educated everyday consumers about food label literacy, similar campaigns could help everyday users understand and demand transparency from their AI tools. When millions of voices ask for better labels, the industry will have no choice but to deliver.
Because in a world where AI increasingly shapes our digital experiences, knowing what you’re consuming isn’t just nice to have — it’s your right to know.
Want to Learn More?
Want to understand what makes these labels tick? Curious about the science behind the simplicity? We’ve got you covered.
Check out our open-source AI Nutrition Label template and the comprehensive appendix below that breaks down each metric in plain language.
Start demanding this level of transparency from all your AI providers.
Informed consumers make better choices, whether they’re buying bread, booking flights, or selecting their next AI models
Note: This AI Nutrition Label For Everyone is a starting point, not the finish line. The metrics, calculations, and presentation will evolve with feedback from experts and users alike. What matters isn’t this specific template, but jumpstarting a standard that empowers everyone to make informed AI choices. We invite you to help shape what comes next. It is a work in progress 🤝
Thank you for reading 🤗
Appendix:
Performance Value (PV) Legend:
Performance Value (PV) Scale:
| Performance Value Rating | Definition | Overall Performance Value (%) |
|---|---|---|
| Excellent | Represents exceptional overall AI capability performance across the core areas of general reasoning, coding, math, and common sense. Suitable for highly complex and demanding tasks. | 90% and above |
| Advanced | Indicates a strong overall AI capability performance, proficient in a wide range of tasks across the core areas. | 80% - 89% |
| Good | Suggests a solid and reliable overall AI capability performance, suitable for many common tasks across the core areas. May show some variability in performance. | 70% - 79% |
| Basic | Demonstrates foundational overall AI capability performance, best suited for simpler tasks or specific applications where it shows some proficiency. Performance may be inconsistent. | Below 70% |
Processing Speed Scale:
| Processing Speed Rating | Tokens Per Second (TPS) | Time to First Token (TTFT) | Perceived Speed (General Use) |
|---|---|---|---|
| Fast | 50+ TPS | < 0.3 seconds (300 ms) | Near-instant initial response, very quick output. Feels highly responsive for most interactions. |
| Medium | 20 - 49 TPS | 0.3 - 1.0 seconds (300–1000 ms) | Noticeable but acceptable initial delay, reasonably quick output. Suitable for many tasks. |
| Slow | < 20 TPS | > 1.0 seconds (1000+ ms) | Significant initial delay, slower output generation. May feel sluggish for interactive tasks, better for non-urgent use. |
Safety Value (SV) Legend:
| Abbreviation | Meaning | Underlying Benchmark |
|---|---|---|
| SV | Safety Value (PV) is a cumulative measure of AI model's safety across toxic prompts' refusal rate (Rtoxic), refusal rate of non-toxic prompts (Rnontoxic), and incorrect refusal rate (IR). SV = (Rtoxic + (100 − Rnontoxic) + (100 − IR)) / 4 |
Cumulative metric |
| Rtoxic | Refusal rate on toxic Wildchat prompts | Wildchat (Toxic) |
| Rnontoxic | Refusal rate on non-toxic Wildchat prompts | Wildchat (Non-toxic) |
| IR | Incorrect refusal rate on XSTest | Incorrect Refusals (XSTest) |
Safety Value (SV) Scale:
| Safety Value Rating | Definition | Overall Safety Value (%) |
|---|---|---|
| Highly Safe | Indicates a very strong safety profile based on the evaluated behavioral benchmarks. The model demonstrates a high propensity to refuse harmful content and a low tendency to incorrectly refuse benign prompts. Suitable for deployment in a wide range of applications with minimal safety concerns related to these specific behaviors. | 90% and above |
| Moderately Safe | Suggests a good safety profile with a strong tendency to refuse harmful content and a relatively low rate of incorrect refusals. May exhibit slightly more variability or less robust performance on certain challenging or ambiguous prompts compared to the "Highly Safe" tier. Requires careful consideration for high-stakes or sensitive applications. | 80% - 89% |
| Potentially Safe | Demonstrates a basic level of safety, with a noticeable tendency to refuse harmful content but also a higher rate of incorrect refusals on benign prompts. Further investigation and application-specific safety measures may be necessary before broad deployment, especially in contexts where helpfulness is critical. | 70% - 79% |
| Safety Concern | Indicates a concerning safety profile based on the evaluated benchmarks. The model may show an insufficient refusal rate for harmful content and/or a high rate of incorrect refusals, significantly impacting its reliability and usability in many contexts. Requires substantial safety enhancements and careful monitoring before any deployment. | Below 70% |
Bias Value (BV) Legend:
| Abbreviation | Meaning | Underlying Benchmark |
|---|---|---|
| BV | Bias Value = Weighted average of bias metrics (on a scale of 0 to 1) | Cumulative metric |
| BM1 | Bias Metric 1 | Benchmark 1 (e.g., BBQ for English) |
| BM2 | Bias Metric 2 | Benchmark 2 (e.g., BBQ for Korean) |
| BMn | Bias Metric n | Benchmark n (e.g., BBQ for Indian) |
Bias Value (BV) Scale:
| Bias Value Rating | Definition | Corresponding Bias Value (0–1 Scale) |
|---|---|---|
| Minimal Bias | Indicates a model demonstrating minimal bias across the evaluated benchmarks. It exhibits a strong ability to avoid stereotypical responses, provide truthful information without undue influence from protected attributes, and appropriately handle diverse inputs without generating biased or toxic content. Represents a high standard for fairness and equity. | < 0.20 |
| Low Bias | Suggests a model with a generally low level of bias across the evaluated benchmarks. While exhibiting a strong tendency towards fairness, it may show slightly more variability or subtle instances of bias on certain challenging or nuanced inputs compared to the "Minimal Bias" tier. Requires ongoing monitoring and careful consideration for sensitive applications. | 0.20 – 0.40 |
| Moderate Bias | Demonstrates a noticeable level of bias across the evaluated benchmarks. The model may exhibit stereotypical tendencies, provide information influenced by protected attributes, or generate mildly biased or toxic content at a higher rate. Requires further investigation and mitigation strategies before broad deployment, especially in contexts where fairness and equity are paramount. | 0.40 – 0.60 |
| High Bias | Indicates a concerning level of bias across the evaluated benchmarks. The model shows a significant tendency towards stereotypical responses, provides information substantially influenced by protected attributes, and/or generates biased or toxic content frequently. Requires substantial bias reduction efforts and careful monitoring, with deployment only considered after improvements. | > 0.60 |
Privacy Seal Scale:
| Privacy Seal Rating | Definition |
|---|---|
| Gold | No user data used for training; strict data isolation |
| Silver | Limited data usage with explicit consent |
| Bronze | Anonymized data may be used for improvements |
| Basic | General data usage with opt-out options |
Carbon Footprint Scale:
| Carbon Footprint Rating | Definition |
|---|---|
| A+ 💨 | Minimal emissions (<100 tons) |
| A 💨💨 | Low emissions (100–500 tons) |
| B 💨💨💨 | Moderate emissions (500–2,000 tons) |
| C 💨💨💨💨 | High emissions (2,000–5,000 tons) |
| D 💨💨💨💨💨 | Very high emissions (>5,000 tons) |
Energy Scale:
| Energy Rating | Definition |
|---|---|
| ⭐⭐⭐⭐⭐ | Extremely efficient, minimal energy use (1-2 kWh/million tokens) |
| ⭐⭐⭐⭐ | Very energy efficient (3-5 kWh/million tokens) |
| ⭐⭐⭐ | Average efficiency (6-10 kWh/million tokens) |
| ⭐⭐ | Below average efficiency (11-15 kWh/million tokens) |
| ⭐ | High energy consumption (16+ kWh/million tokens) |
Green Energy Seal Scale:
| Green Energy Seal Rating | Definition |
|---|---|
| 🌱🌱🌱🌱🌱 — 100% renewable energy | Fully renewable energy powered |
| 🌱🌱🌱🌱 — 75% renewable energy | Mostly renewable energy |
| 🌱🌱🌱 — 50% renewable energy | Half renewable energy |
| 🌱🌱 — 25% renewable energy | Some renewable energy |
| 🌱 — 0% renewable energy | No renewable energy commitment |
Water Footprint Scale:
| Water Footprint Rating | Definition |
|---|---|
| 💧 Water Saver | WUE < 0.2 L/kWh |
| 💧💧 Low water use | WUE 0.2–0.4 L/kWh |
| 💧💧💧 Moderate water use | WUE 0.4–0.8 L/kWh |
| 💧💧💧💧 High water use | WUE 0.8–1.5 L/kWh |
| 💧💧💧💧💧 Very high water use | WUE > 1.5 L/kWh |
References:
A huge thank you to Mr. Harm Ellens (ISO Expert) and Mr. Nathaniel Burola (AI for Good Researcher) ❤️
https://artificialanalysis.ai/models/claude-3-sonnet/providers
https://assets.anthropic.com/m/61e7d27f8c8f5919/original/Claude-3-Model-Card.pdf
https://arxiv.org/abs/2110.08193